Spark Charts
Insights into energy's future
The energy transition is unfolding rapidly around the world, as cleaner and lower-cost energy and technologies displace dirtier, more expensive incumbents. Learn more about the breadth of this historic transformation via the charts, graphs, and data visualizations collected here.
Islands | May 18, 2026
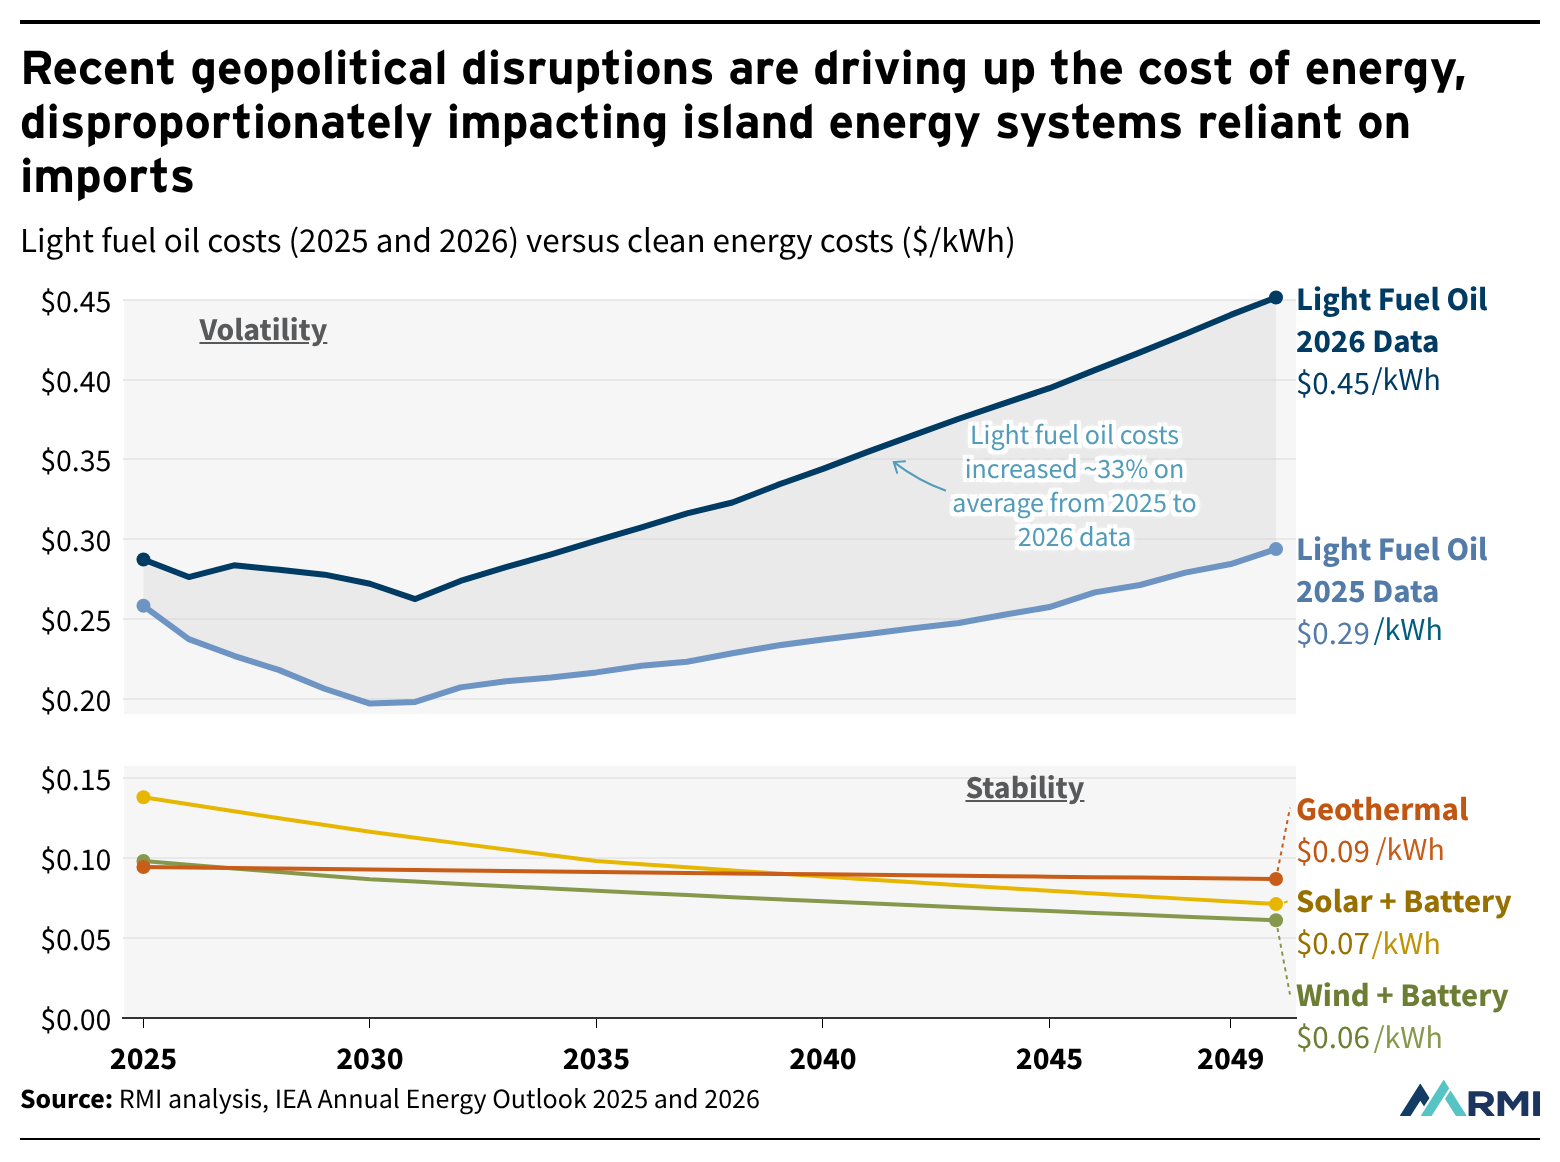
As Islands Grapple with Spiking Fuel Costs, Renewables Offer a More Secure and Affordable Option
According to the EIA's latest Energy Outlook, island fuel oil costs spiked 33% in one year. However, solar, wind, and geothermal costs remained low and continue to fall.
Climate Data | May 4, 2026
The World Wastes More Gas Each Year Than the Strait of Hormuz Supplies
“It is not that we have a short time to live,” the ancient Roman philosopher Seneca once wrote, “but that we waste a lot of it.” His point — that we often waste things that hold great value — echoes through the centuries. As the closure of the Strait of Hormuz forces governments around the […]
Climate Data , Oil and Gas Solutions | February 23, 2026
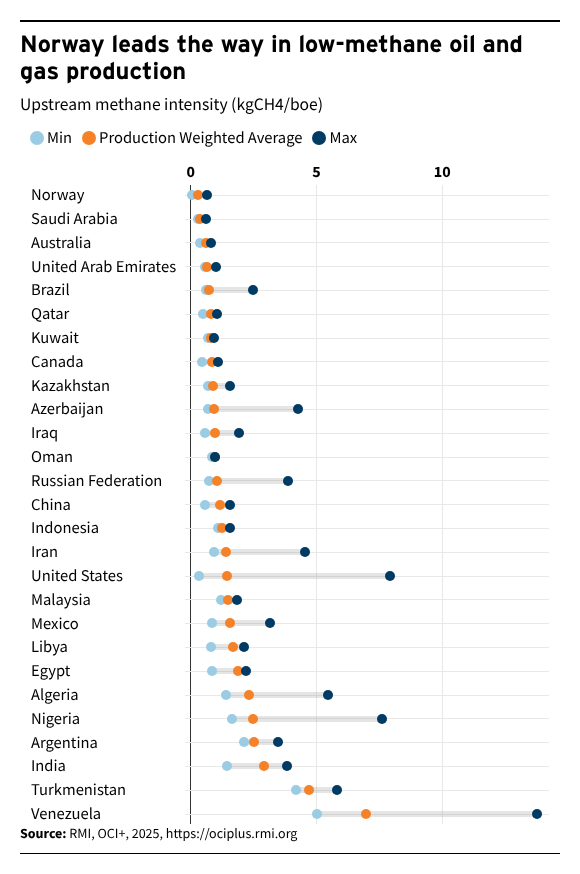
Norway’s Wins Go Beyond the Olympic Podium
Norway has won the most medals at the Winter Olympics since the games began in 1924 — 405 total, including 148 gold. On top of its winter sport dominance, Norway has led the way in clean energy and emissions reduction. Approximately 98% of electricity is from hydro or wind power Norway has a legacy of […]
Electricity | February 18, 2026
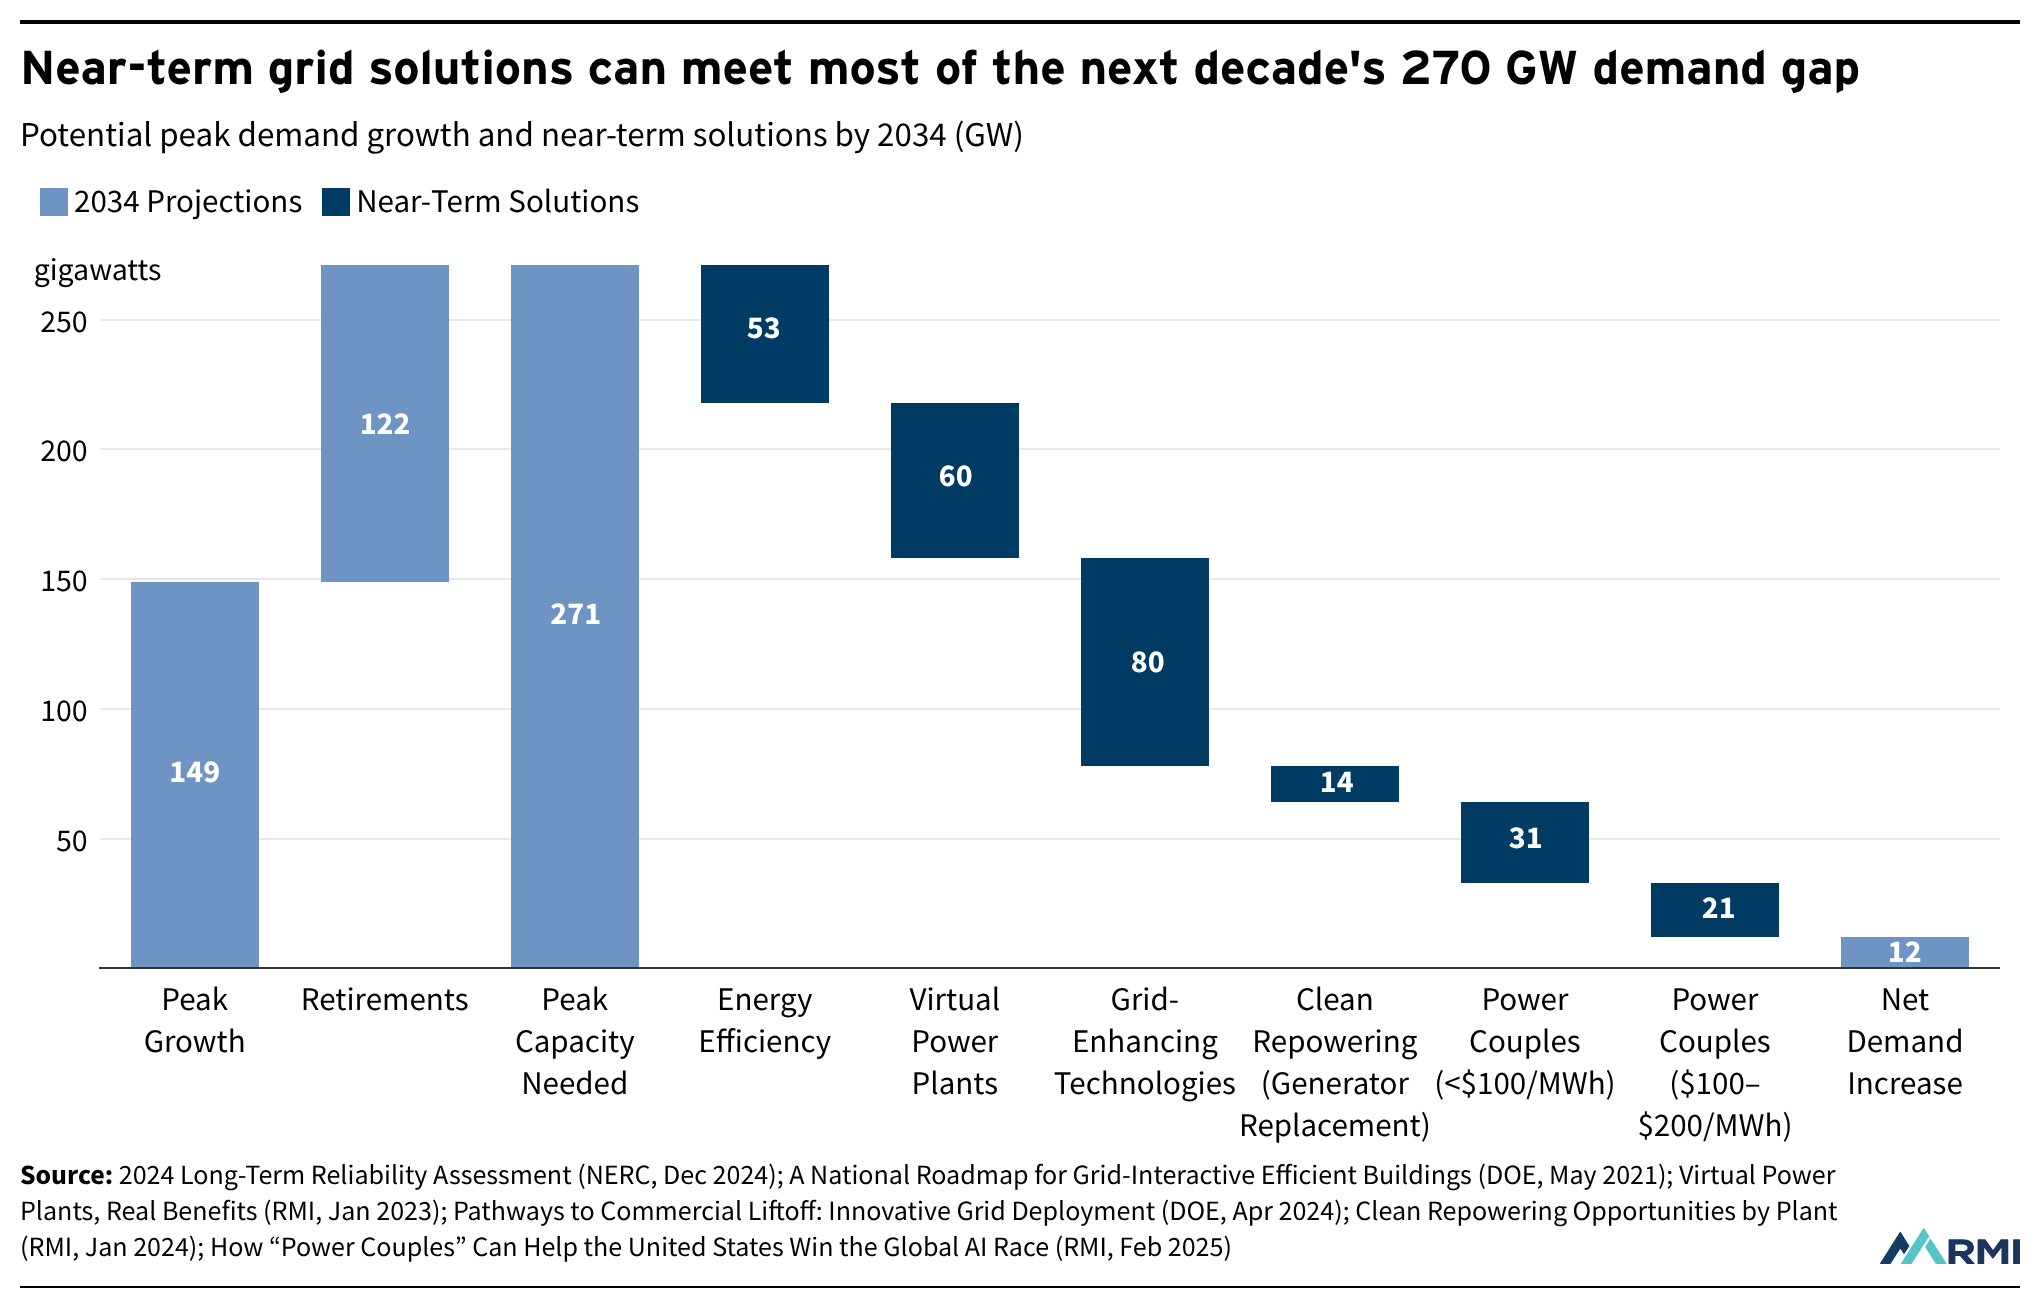
Fast, Efficient Solutions to Meet Electricity Demand Growth
We have the technology and solutions to upgrade and expand our electricity grid while deferring costly infrastructure investments.
Transportation | January 30, 2026
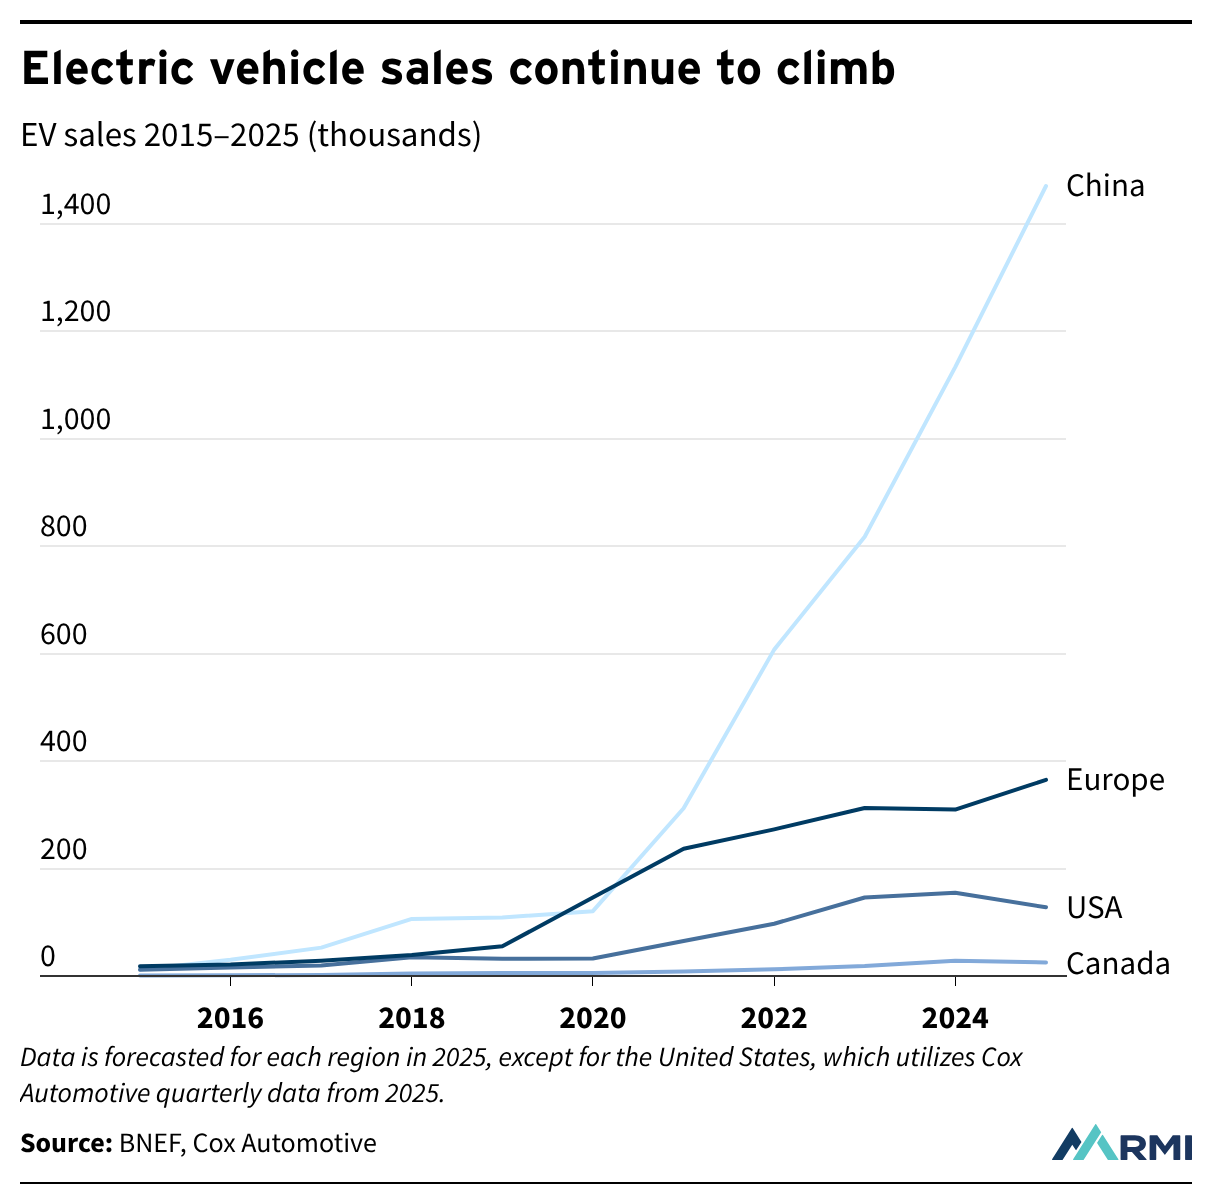
EV Sales Are Growing — How Do We Keep the United States in the Game?
As US sales projections cool, EV demand is accelerating globally.
Climate Data , Supply Chain Emissions | January 21, 2026
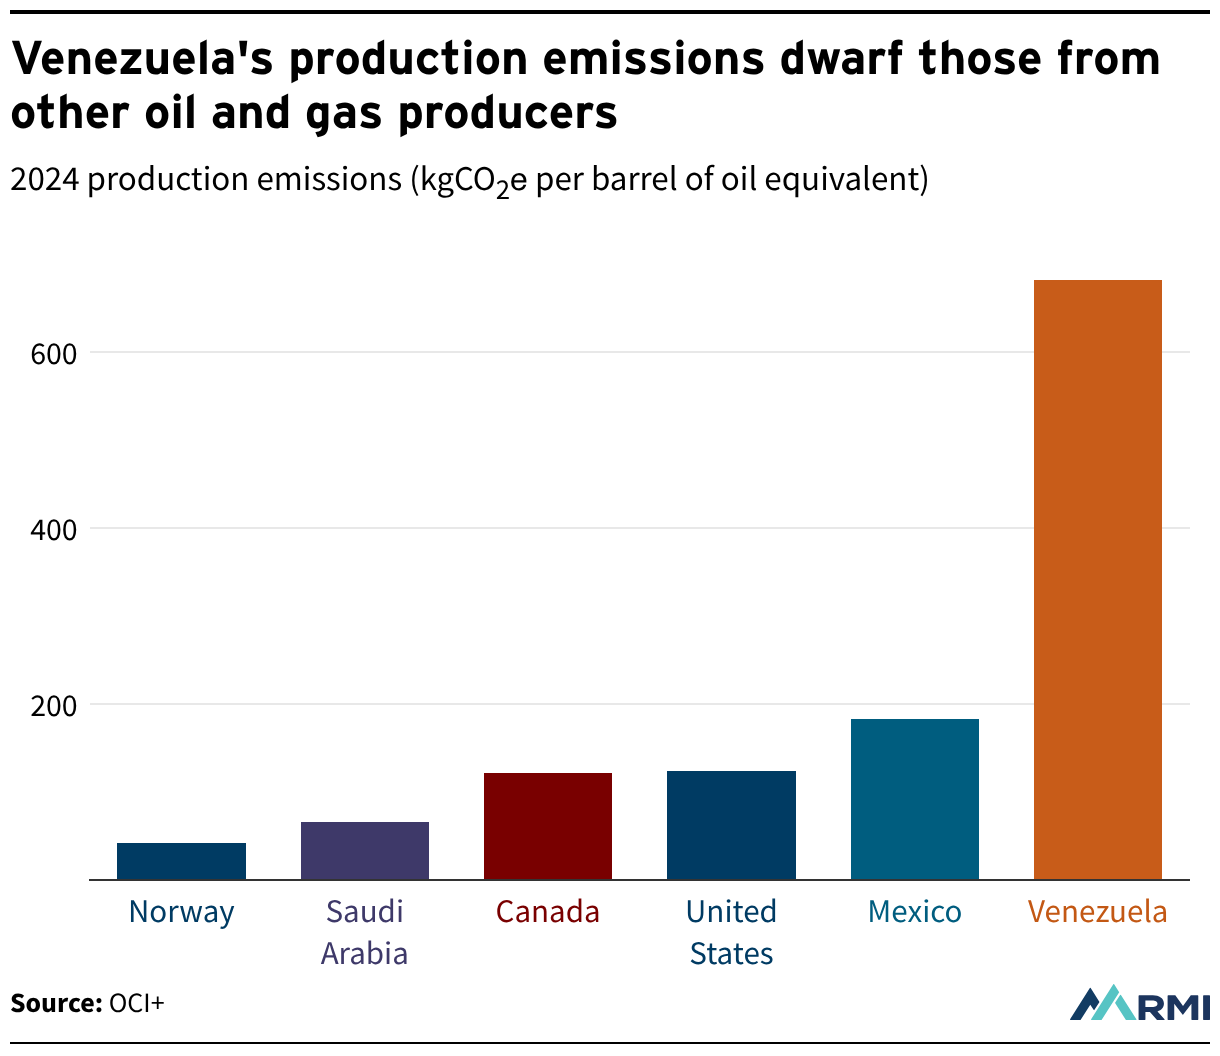
Venezuela’s oil future is murky. But its production emissions are all too clear.
Venezuela's oil is already at a disadvantage among buyers of lower-emissions product.
Climate Data , Oil and Gas Solutions | December 22, 2025
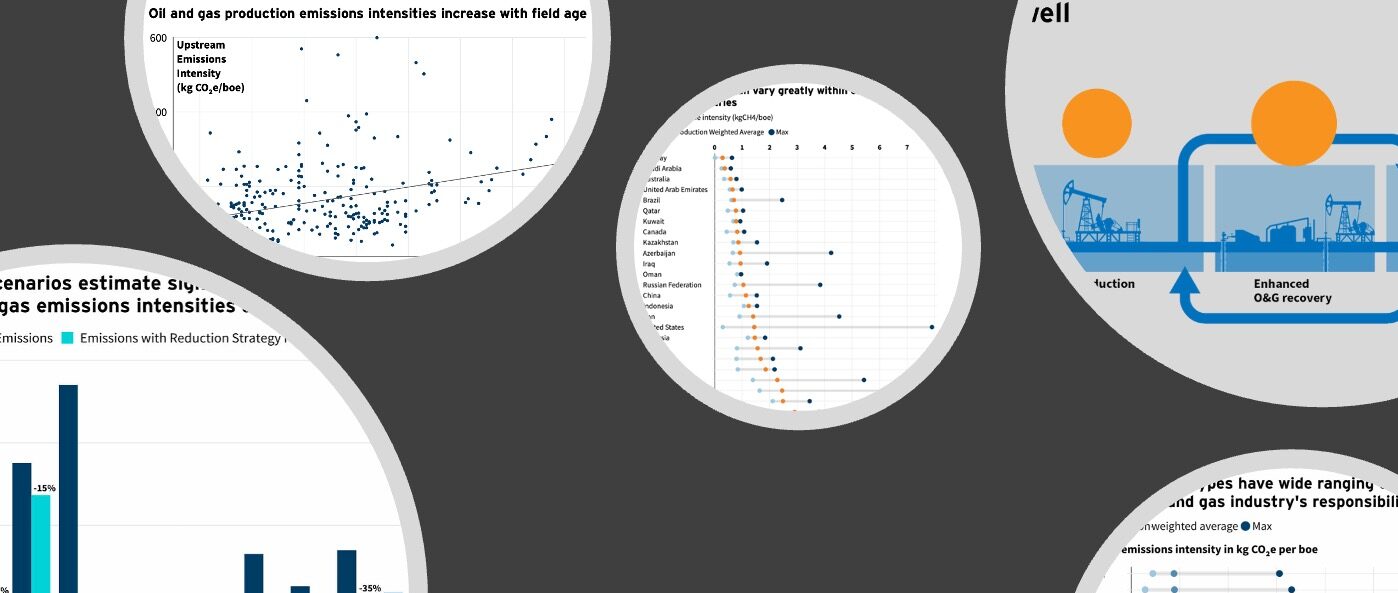
How many emissions are in a standard barrel of oil and gas? It’s complicated but quantifiable.
Emissions from oil and gas vary by asset, location, and age.

Spark Chart , US Policy | December 2, 2025
The Five Types of Electro-Industrial States
Which states are best poised to take the lead in the “electro-industrial” era?
Spark Chart , Strategic Insights | August 13, 2025
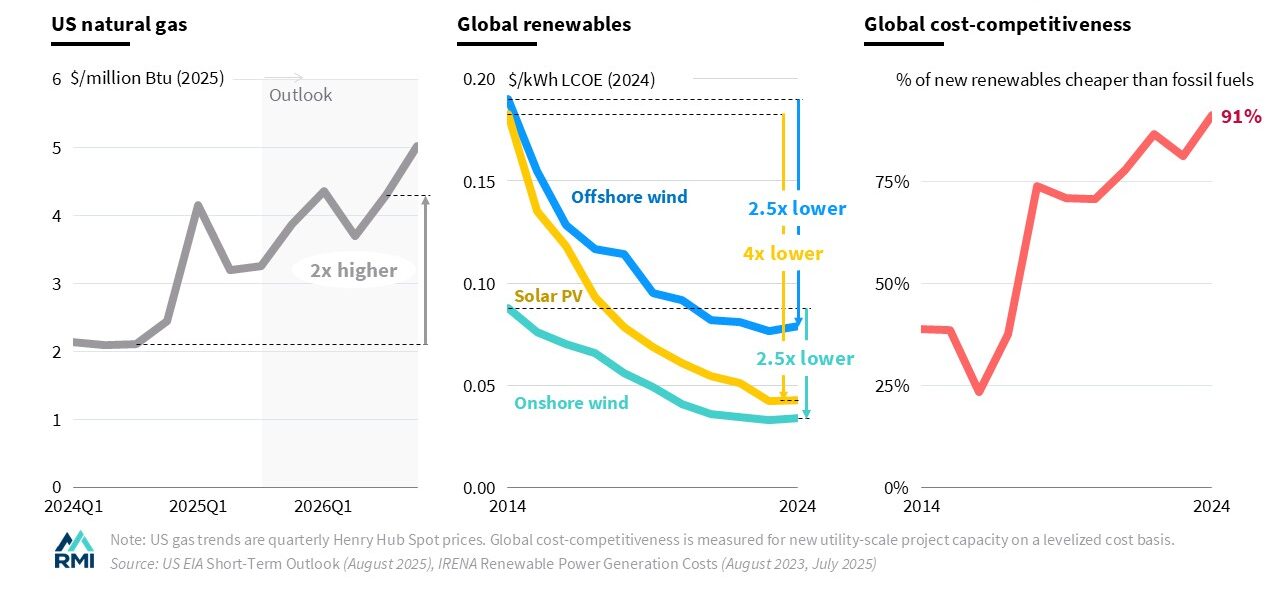
Volatility vs. Affordability: Globally, Renewables’ Cost Advantage Grew Last Year
While US natural gas prices are on the rise, more than 90 percent of last year's new global renewable energy capacity was cheaper than a fossil fuel alternative.
Spark Chart , Strategic Insights | July 31, 2025
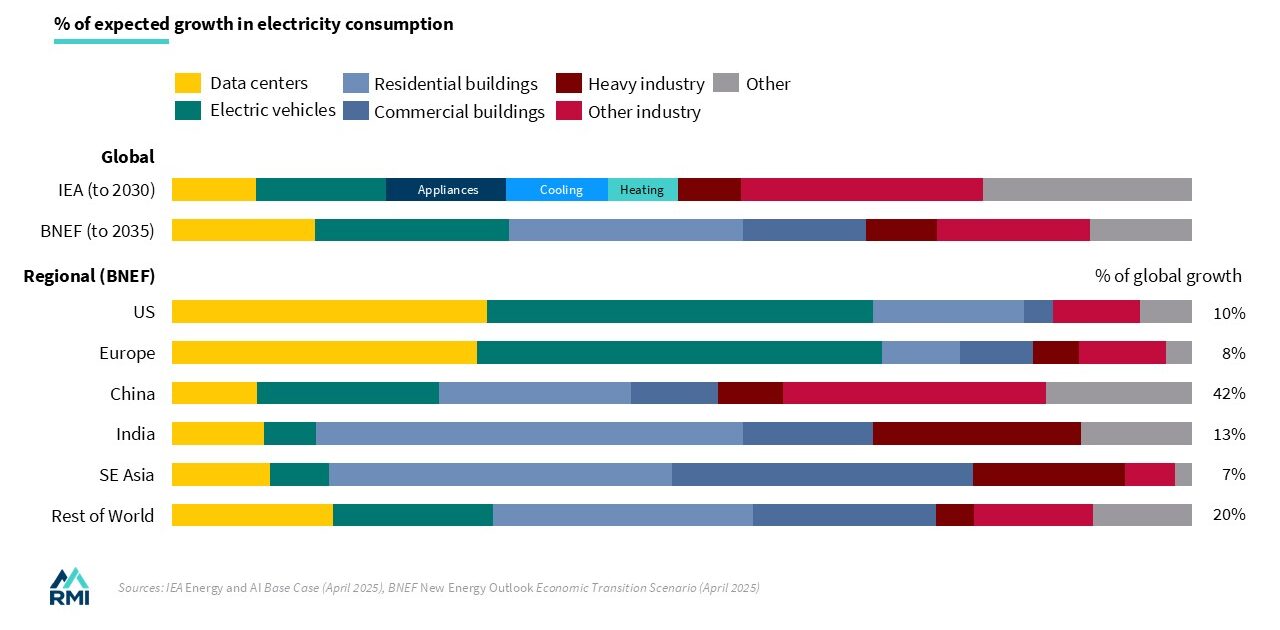
Three Priorities for a New Age of Electricity Load Growth
Demand growth is being caused by more than data centers, and rising electricity costs call for system solutions.
Industry , Spark Chart , Strategic Insights | April 28, 2025
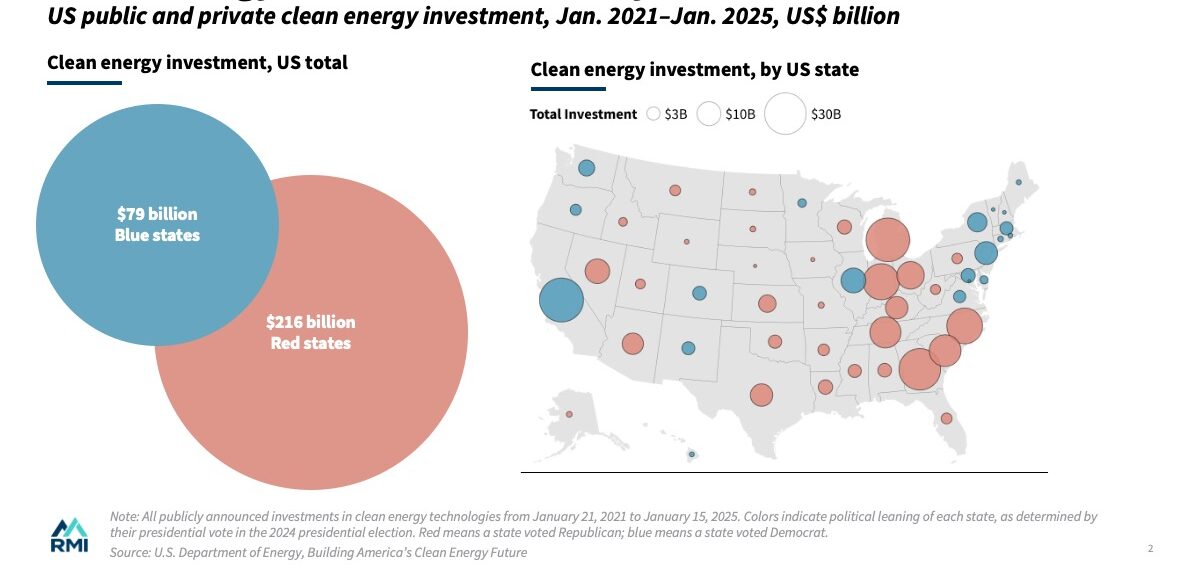
Trillion-dollar Win: Clean Energy Investment Benefits Growth and Jobs in All States
As federal clean energy incentives are targeted, red states face bigger losses.
Strategic Insights | April 14, 2025
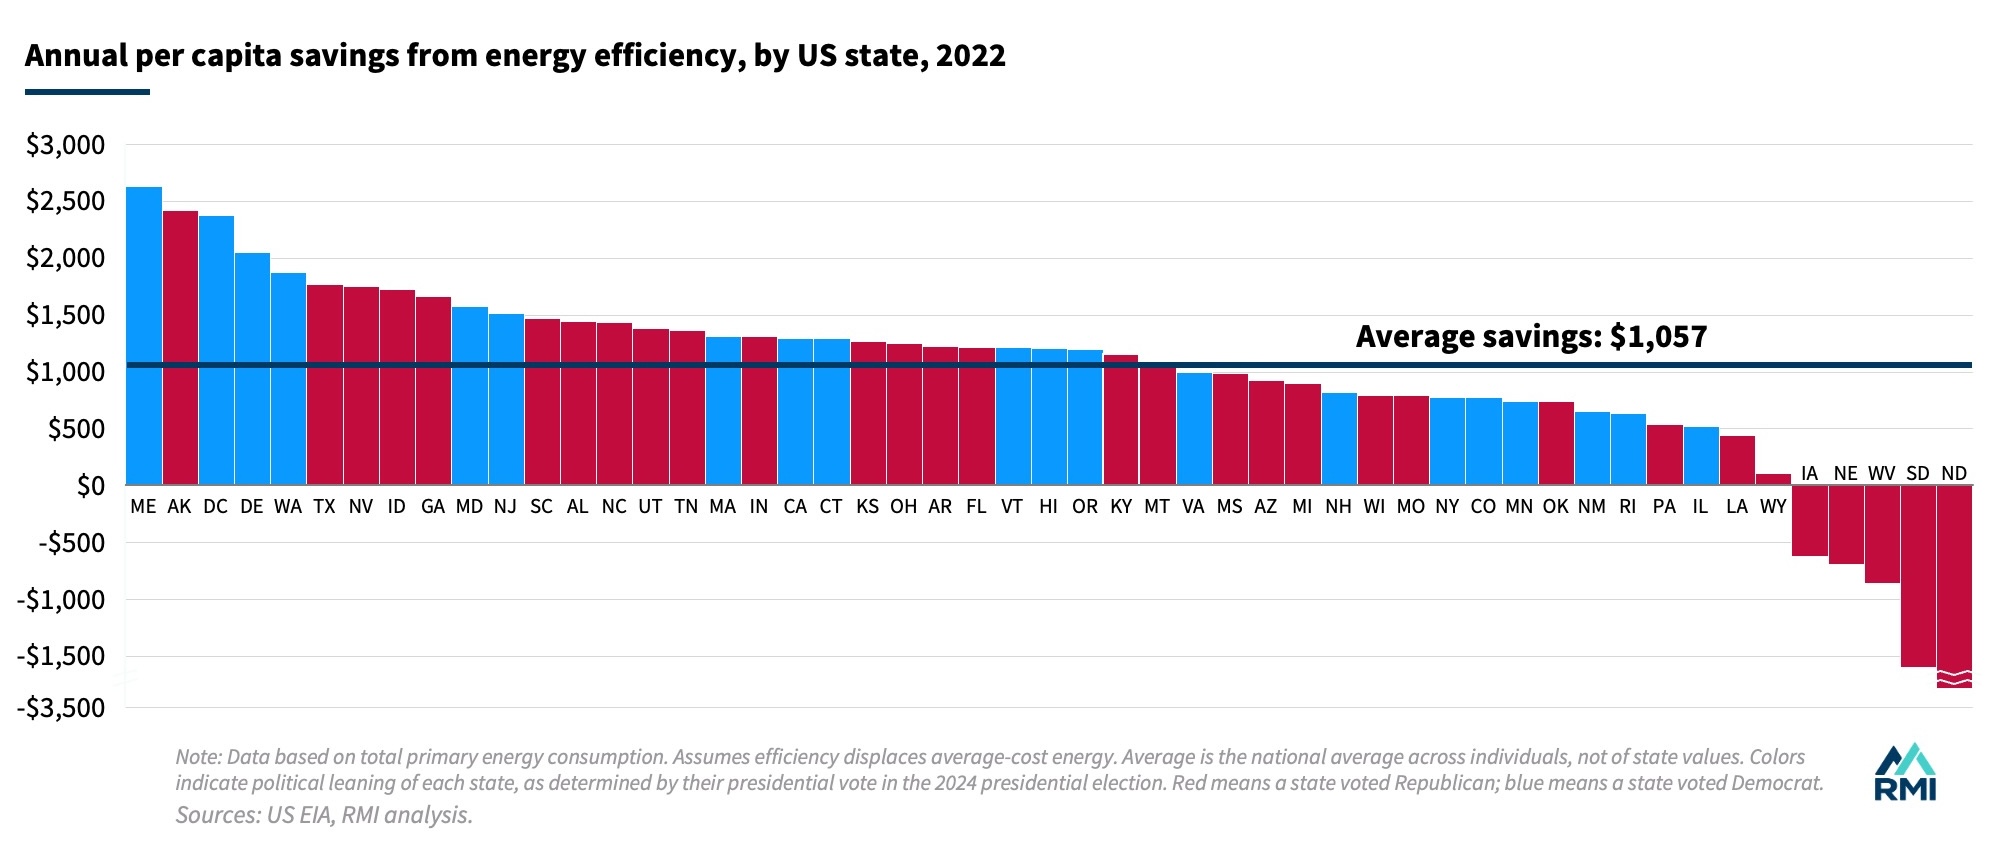
How to Save Money for All Americans: Efficiency
Energy efficiency gains made since 2000 save the average American over $1,000 per year.
Strategic Insights | March 26, 2025
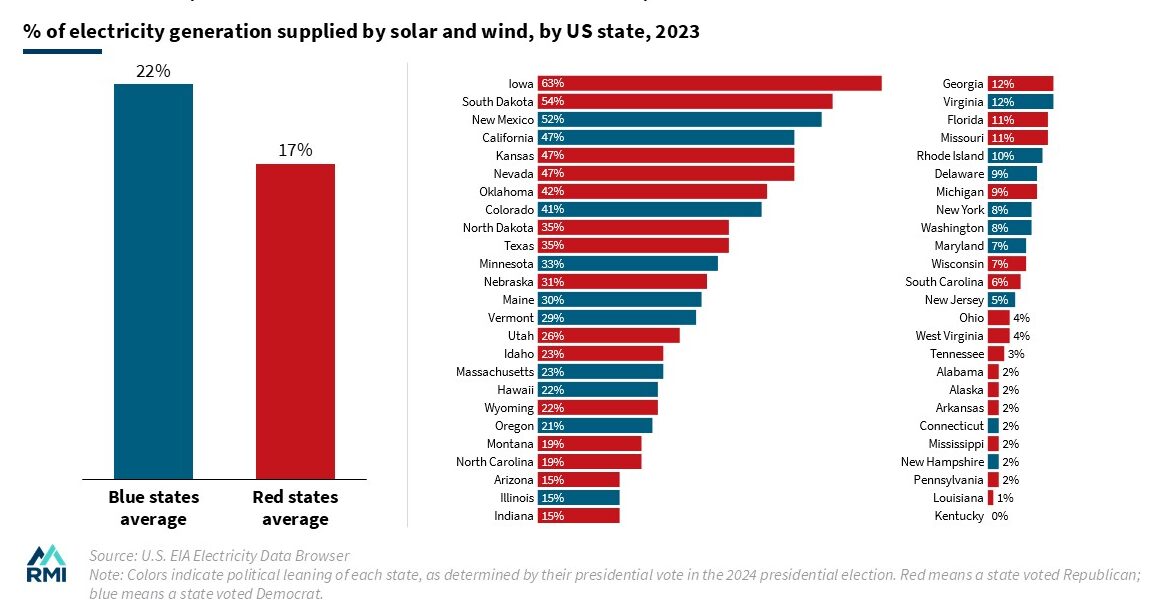
Clean Energy Crosses the Political Aisle
Nationwide, solar and wind show more unity than division.
Spark Chart | July 29, 2024
The Energy Transition in Three Xs
Solar and wind take over electricity; electricity takes over energy; efficiency reduces wasted energy.
Spark Chart | July 29, 2024
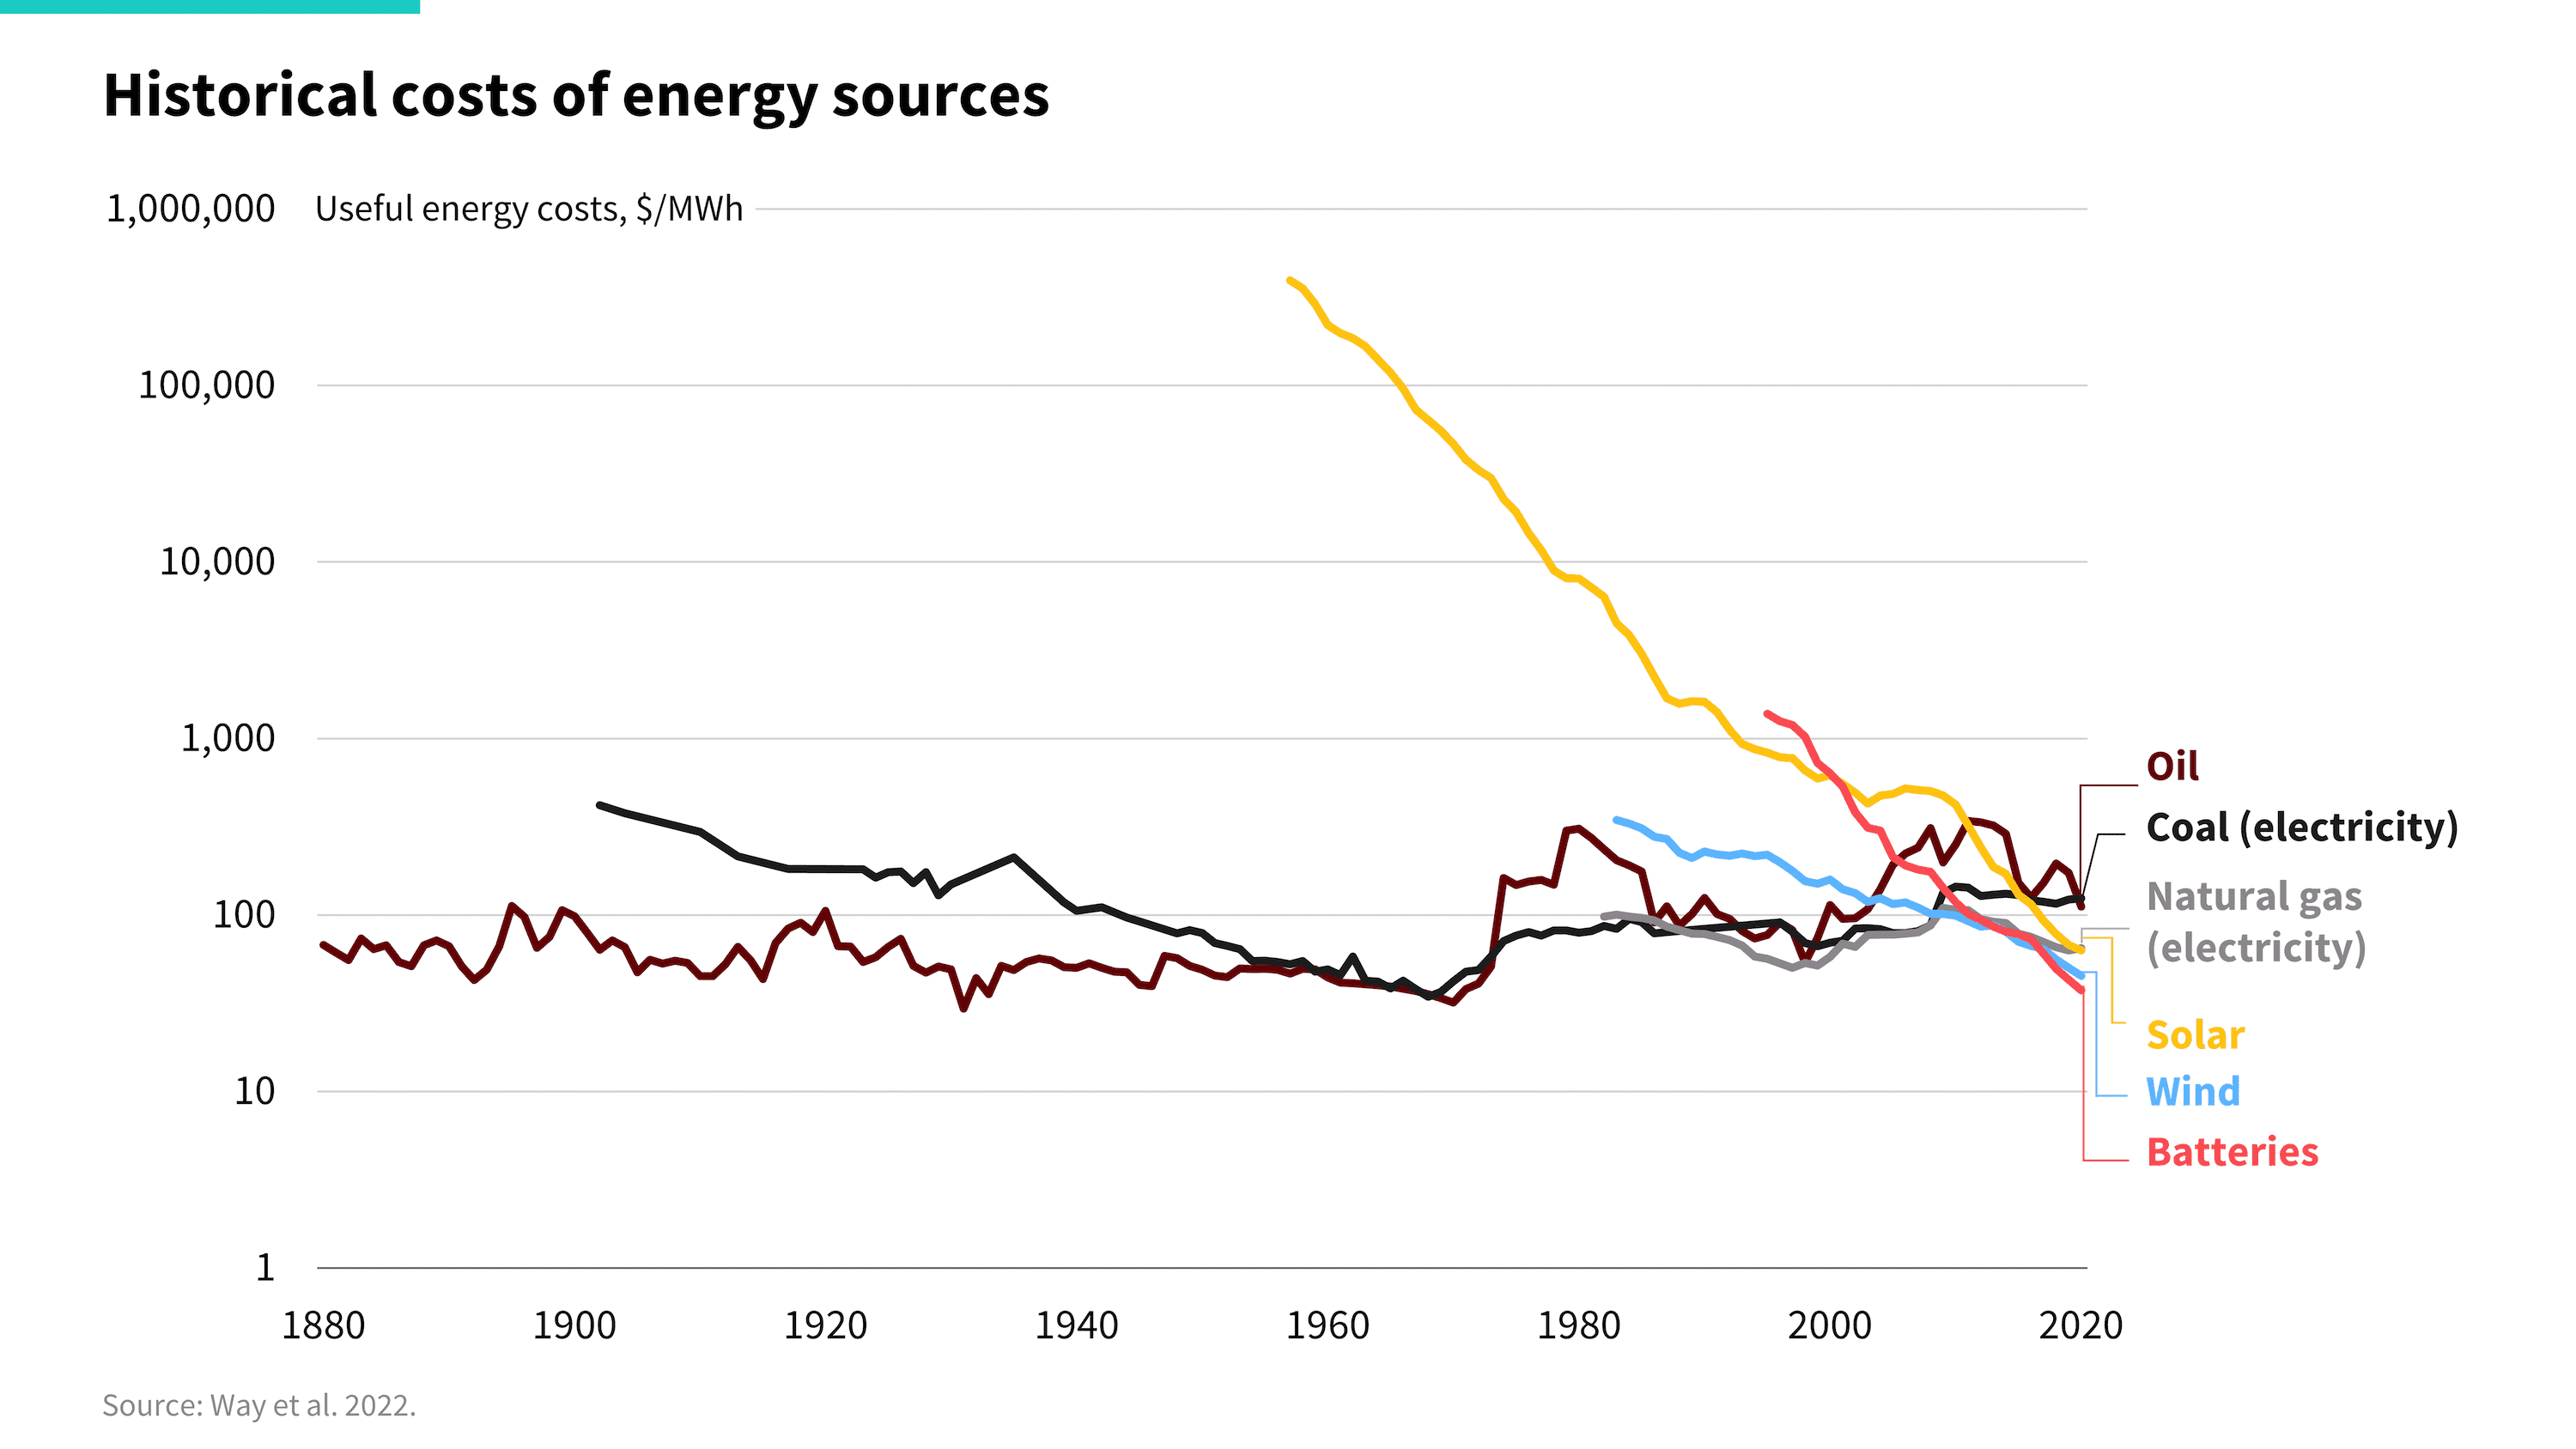
In the Shift to Clean Energy, New Technologies Beat Old Commodities
Over time, scaling clean technologies has got dramatically cheaper, yet digging fossil fuels has not. For the energy transition, this means new energy technologies have a compounding cost edge over old fossil fuel commodities.
Spark Chart | July 29, 2024
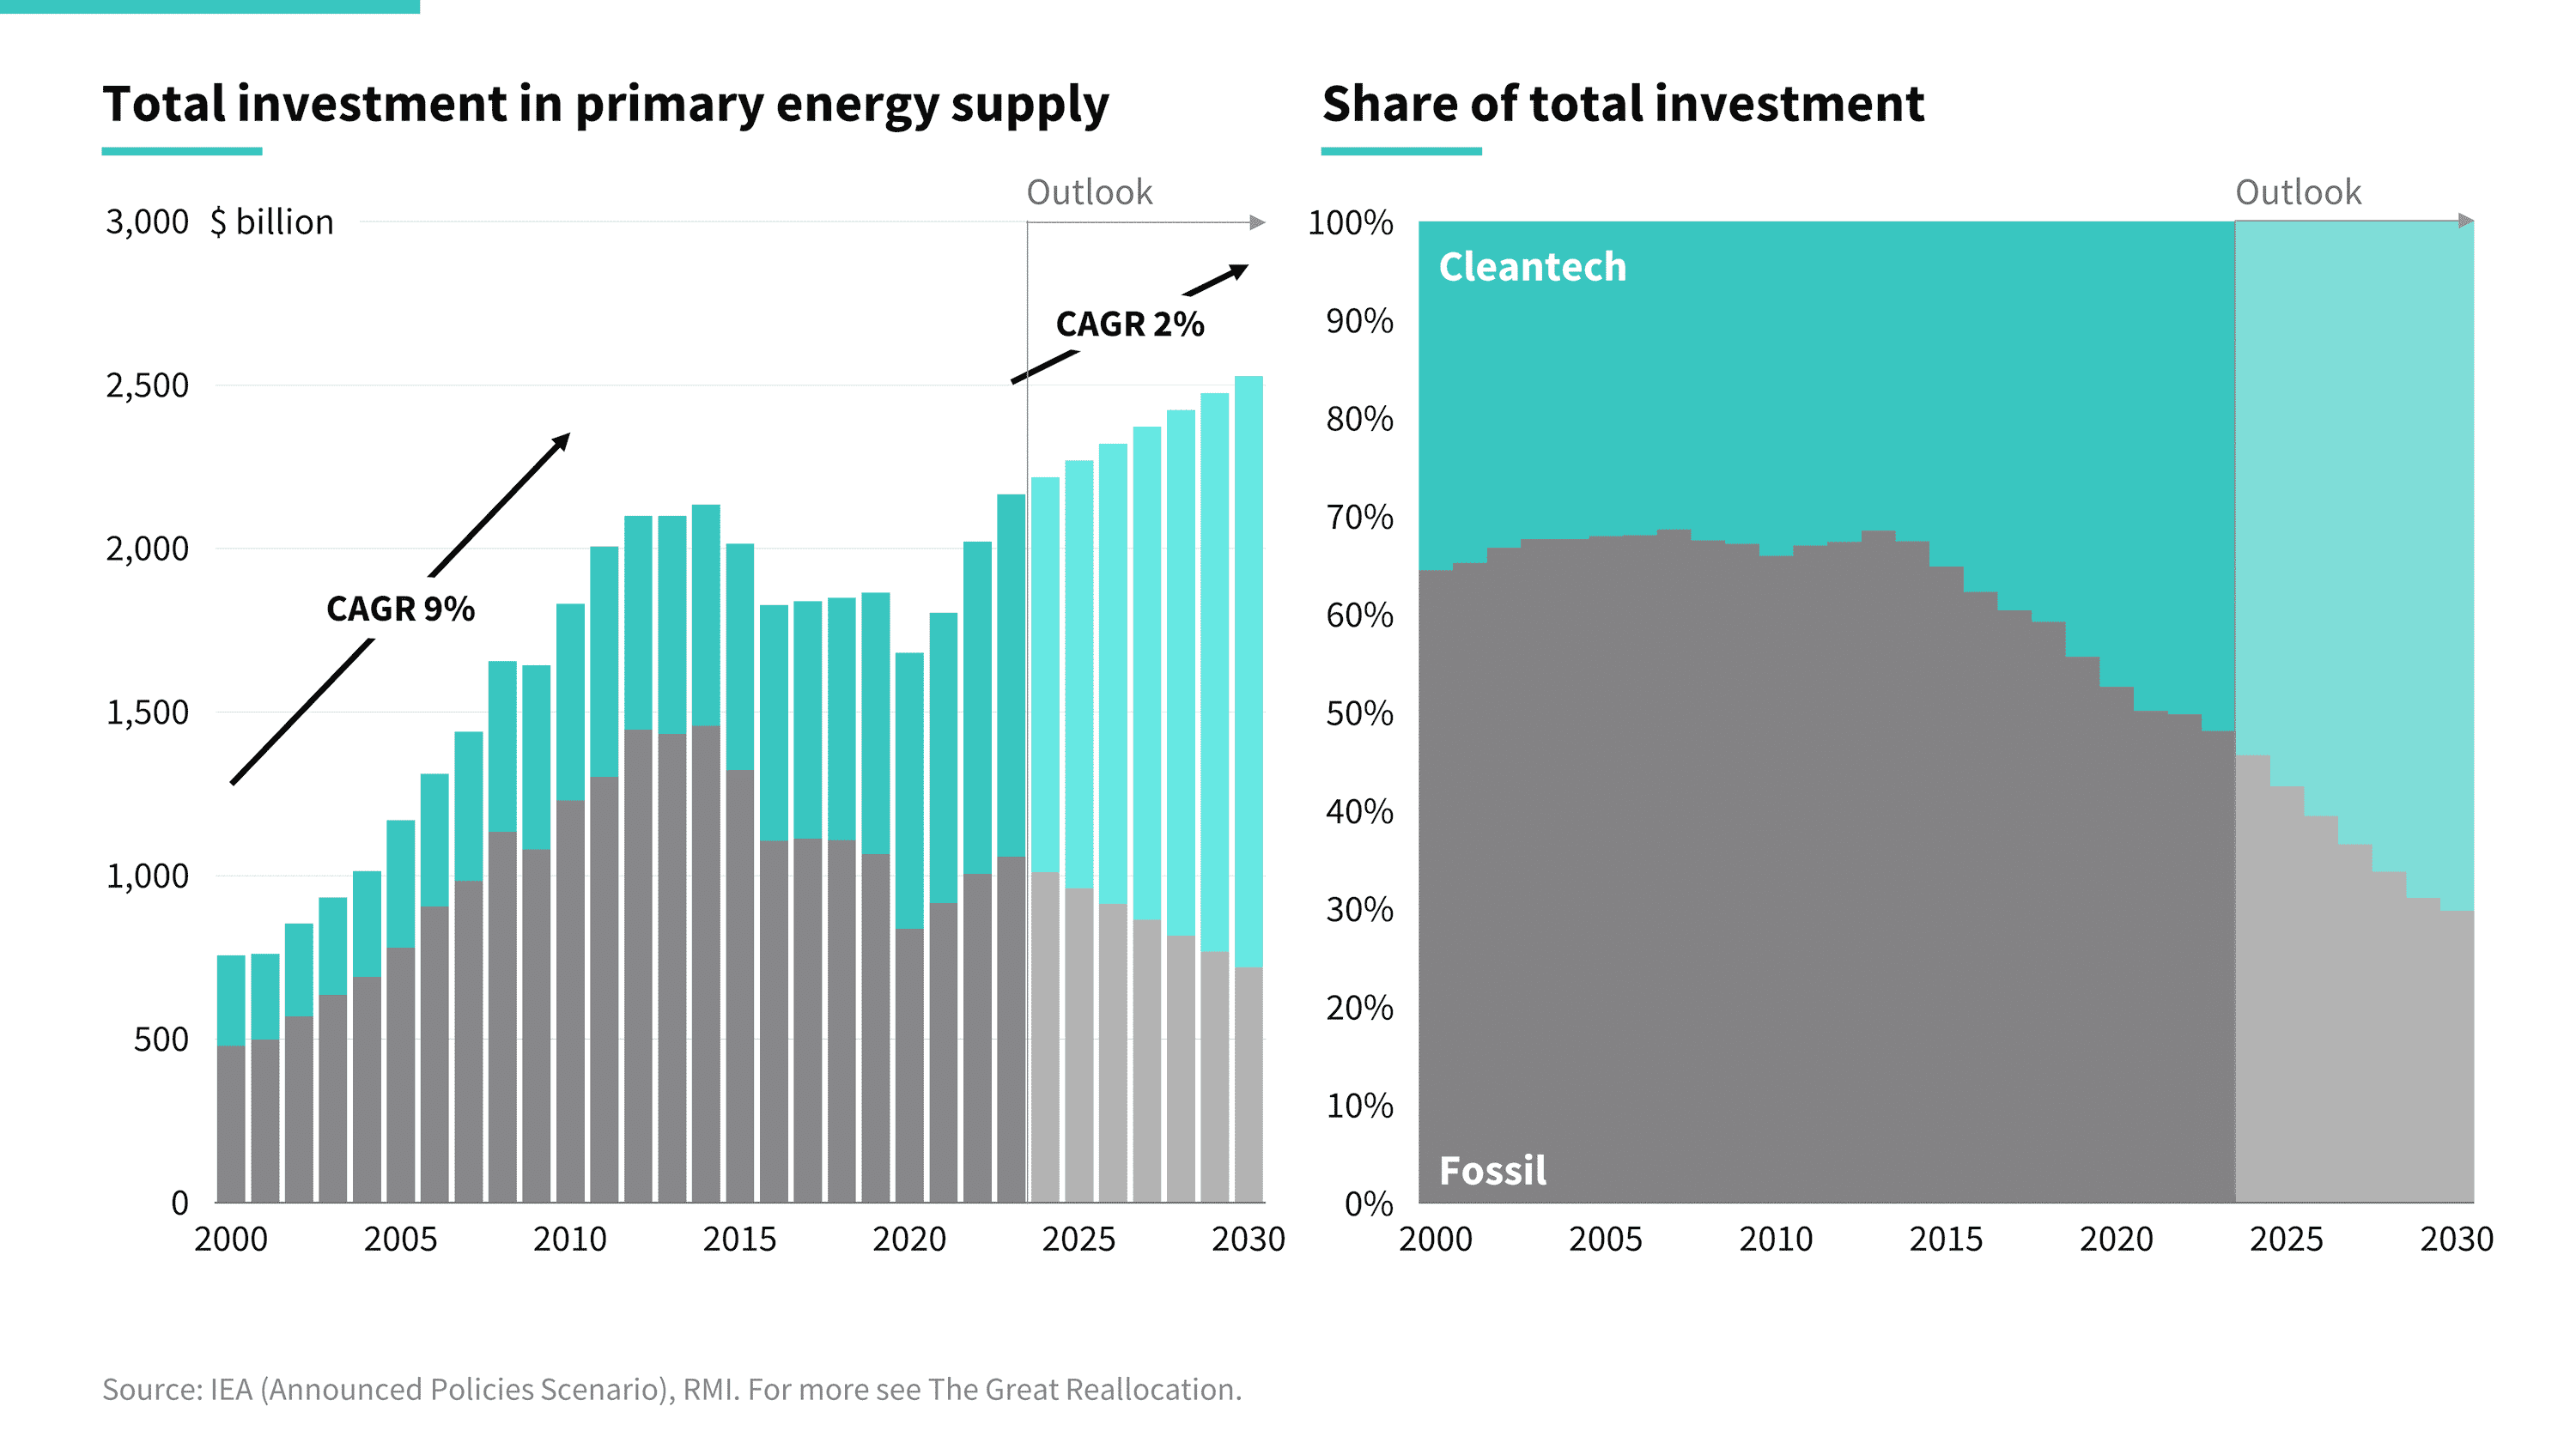
The Great Capital Reallocation
The required growth in investment is achievable, and we are already halfway through the reallocation.
Spark Chart | July 29, 2024
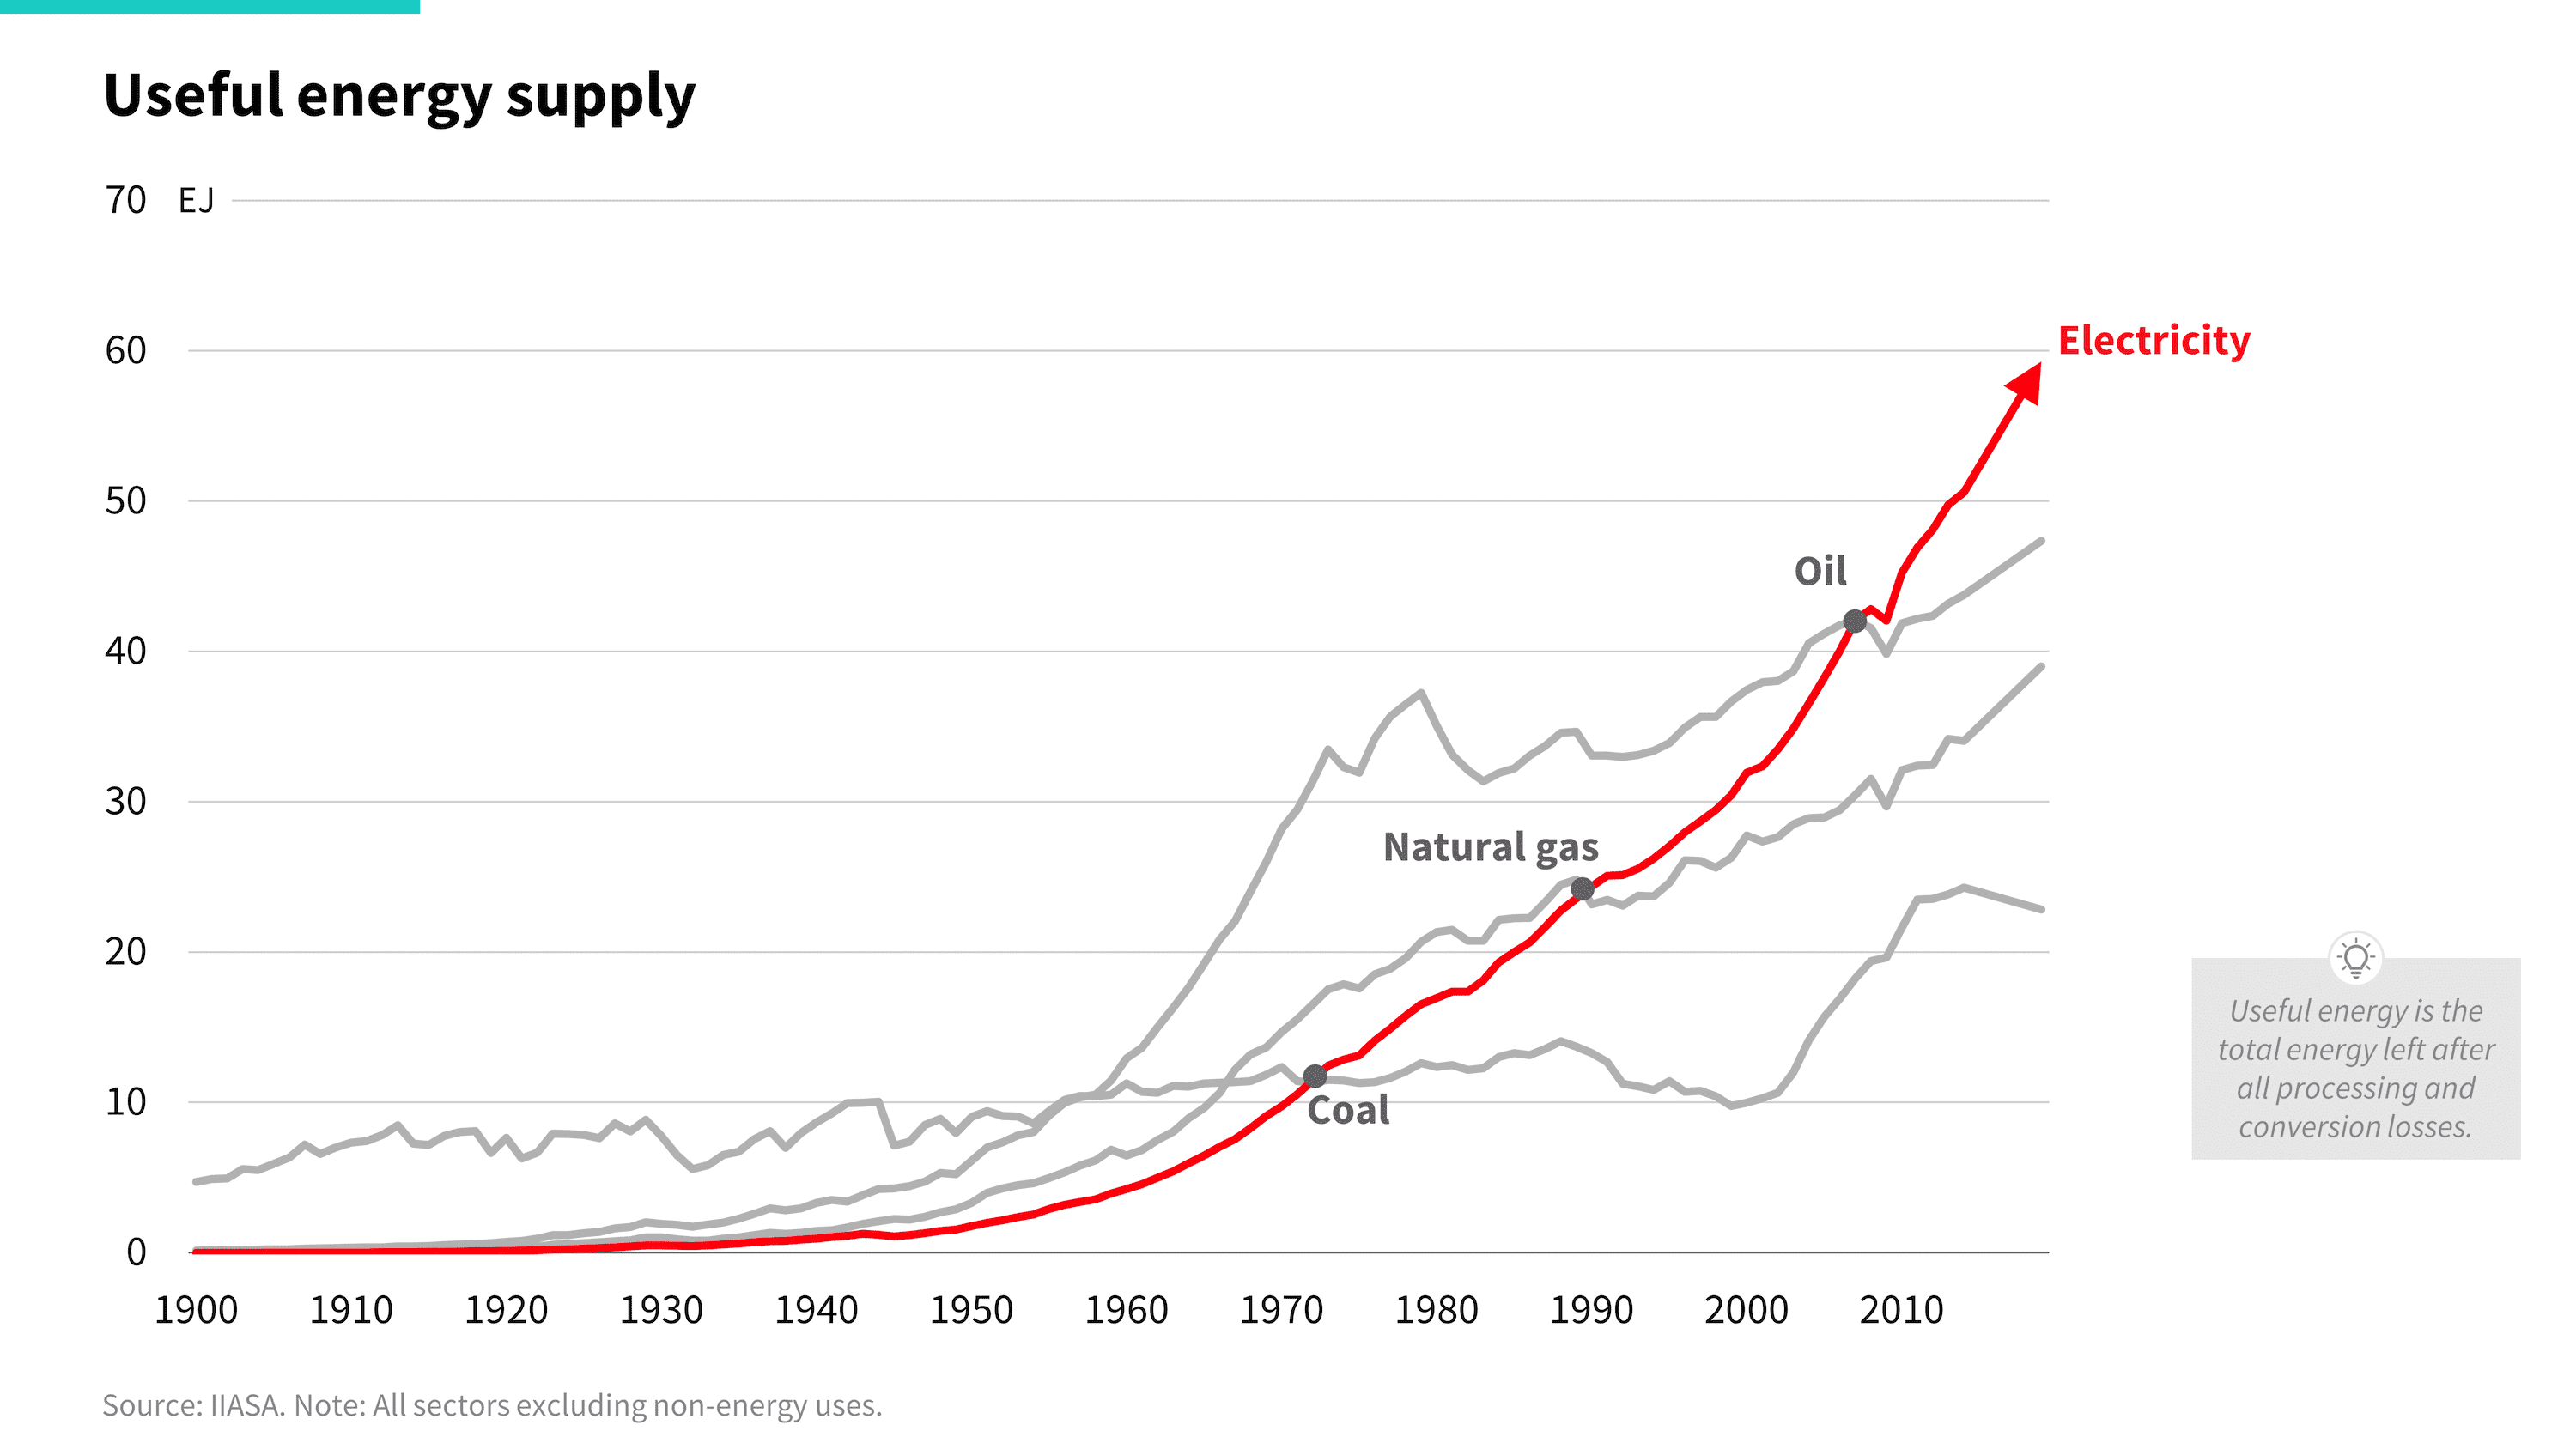
Why Electricity Is the New King of Energy
Electricity is now the largest supplier of useful energy, and it has plenty of growth ahead.