3d rendering ev logistic trailer truck or electric vehicle lorry at charging station

Increasing the Number of Electric Trucks We Can Charge Through Flexible Service Connections
Fleet load shifting can unlock grid capacity for thousands of electric trucks in Northern California without triggering grid upgrades — and could scale to utilities across the country.
Energizing new electric vehicle charging infrastructure can be a long and costly process. This is especially true for electric truck charging depots during this era of high electricity load growth and long queues to connect to the grid.
As RMI explained in our article “Electrification 101: Enabling Truck Charging with Flexible Service Connections,” when a new charging site wants to connect to the grid, conservative utility planning processes consider the highest possible load hour of the year on the local distribution grid and the highest possible load hour that site could reach. Then, if the maximum safe operating limit of the local distribution system is reached, the utility denies the request until costly upgrades can be completed. This happens even if that limit would only have been reached for just a single hour of the year at a time the site wasn’t even planning to charge vehicles.
Flexible service connections are a new and necessary solution for unlocking this underutilized grid capacity. Through formalizing agreements where a site can connect to the grid provided, they curtail their load during constrained peak hours for the local distribution system. This approach accelerates timelines for new site energizations for fleets, saves them money on site upgrade costs, and enables utilities to grow their rate base of customers with existing infrastructure, saving them money too.
RMI recently analyzed truck driving behavior and public electricity grid data from Northern’s California utility PG&E, a current leader in this approach with its FlexConnect program. We found that if new charging depots utilized flexible service connections, shifting just 1 megawatt of their load away from peak hours by several hours for the limited days required by the utility, the majority of feeders could charge 10 more heavy-duty trucks than is possible under business as usual load planning approaches. Additionally, for most heavy-duty fleets this would not interfere with their regular operations at all and would just require charging management over the time they are already parking at the depot – something that can be done automatically with software.
Scaling this across PG&E’s approximately 2,000 feeders could mean charging an additional 25,000–70,000 heavy-duty trucks per year depending on duty cycle. This is more than enough to absorb the load of every electric truck purchased in California last year with zero grid upgrades required. By connecting charging sites faster and making grid connection costs cheaper, flexible service connections can be a key enabler in the transition to electric trucks.
RMI’s optimization model
RMI developed a model that identifies when truck charging load curves coincide with the peak load hours on feeders that normally act as a bottleneck to new service connections. The model applies charging load curves for representative new charging depots derived from Geotab telematic data for regional-haul and urban delivery heavy-duty trucks in California onto these bottleneck hours. This identifies just how many additional trucks could be charged on that feeder by shifting load away from the peak in hourly increments across a “flexibility window” so as not to exceed the maximum allowed feeder capacity while still fulfilling the fleets charging needs. In the simplest case of a two-hour flexibility window, load is shifted one hour away from the peak hour. More complex cases of larger window sizes are explained in the exhibit below.
Can fleets shift their charging without impacting operations?
Prior RMI analysis found that on average, heavy-duty trucks with daily mileages below 300 miles are parked at their depot after completing their routes each day between 4 p.m. and 5 a.m. This period entirely covers the peak grid hours in California, and much of the rest of the country. That study also found that on average, heavy-duty trucks in California require less than half of their time at their charging depot to sufficiently charge at 75 kilowatts (kw), and many fleets use higher power chargers. This means that the average Californian fleet could successfully shift a large portion of their load away from peak hours with no operational impact. Even without the defined load-shifting requirement of a flexible service connection, fleets can save up to 30 percent off their electricity costs by shifting charging away from peak time-of-use rates.
The scale of the benefits
The greater the number of hours that a fleet can shift its load away from the peak, the greater the number of additional trucks that could be charged on an average feeder under a flexible service connection. As the flexibility window over which load is shifted increases from 2 to 6 hours the additional trucks able to be charged on the median feeder in PG&E territory increases from 3 to 22 for a regional heavy-duty truck, and from 9 to 64 for an urban heavy-duty truck. Scaling this across all feeders in PG&E territory means absorbing the load required to charge 8,000 to 41,000 extra regional trucks and 22,000 to 112,000 extra urban trucks.
Even without ACT, truck electrification in California continues
Although California’s Advanced Clean Truck (ACT) rule mandating the sale of electric trucks has now been revoked, California still has a target of transitioning 100 percent of new heavy-duty truck sales to electric by 2045 and provides substantial incentives available for their purchase. With 130,000 trucks of all weight classes and powertrains currently sold across California per year and PG&E just being one of many utilities in California, flexible service connections have the potential to absorb a large portion of the load growth from new electric truck sales.
However, all feeders are different based on the load sources in their vicinity, making some better candidates for reaping the benefits of flexible service connections, as shown in the exhibit below. For example, in RMI’s analysis, nearly 500 feeders were modeled to support the load of greater additional trucks than the median for six hours of load flexibility. Utilities will still need a load study or real-time data monitoring capabilities to assess the potential for flexible service connections on their feeders. They will likely prioritize adding these agreements to customers on those feeders with the highest potential for unlocked capacity first, in order to get the best demonstration of the potential benefits of this approach while these programs are still in their infancy.
When is flexibility most beneficial?
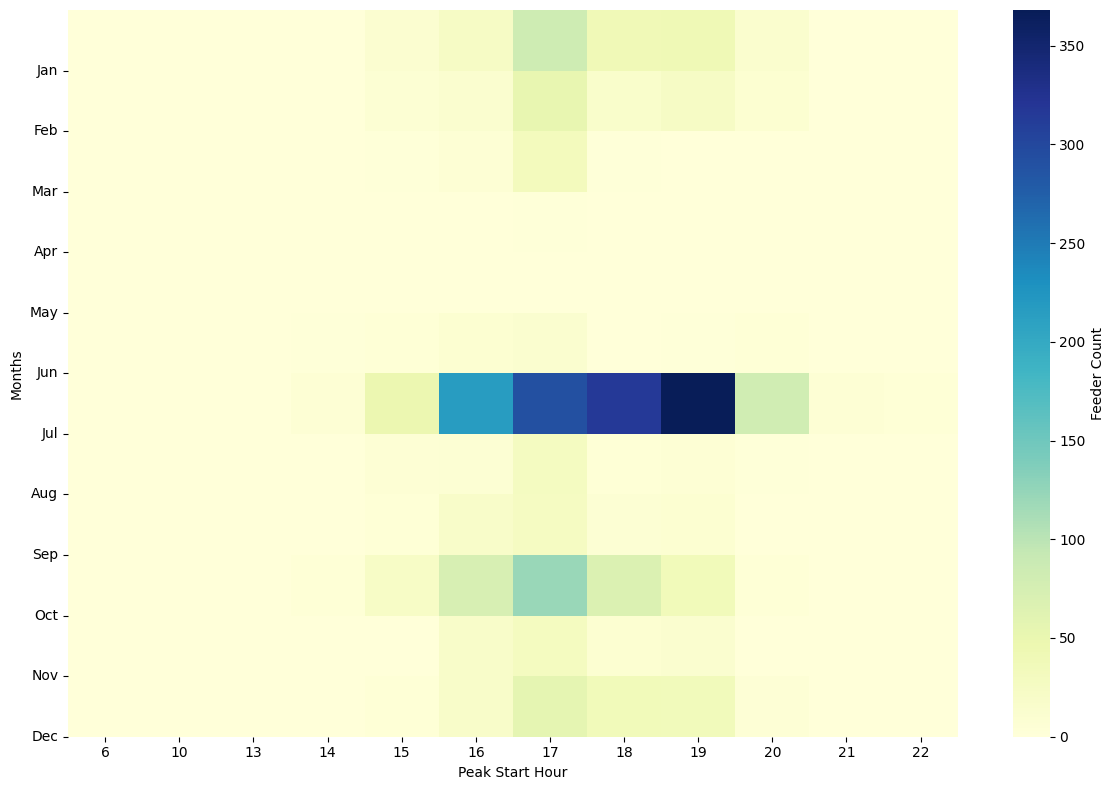
Peak load hours on feeders in northern California, and in much of the country, are typically from 4 to 9 p.m. during the summer months, as solar energy drops offline and people return home from work. Our modeling found that for 60 percent of the nearly 2,000 feeders we analyzed, new charging sites for heavy-duty trucks would only be required to load shift during July for the two-hour scenario.
The heatmap below shows the starting peak hours for which load-shifting was triggered across the year, with darker shading indicating that more feeders required load-shifting at that hour. For some feeders, load shifting was required as early as 2 p.m., which is even more favorable for the average fleet as they are often still driving then. The plots show how as the flexibility window expands and more capacity can be eked out of the underutilized grid, it becomes necessary on some feeders to load shift over more than just summer months. In other words, a greater number of longer limiting peak periods can be overcome through load shifting, although in the four-hour window analysis shown below half of all feeders still only require load-shifting during July, with fleets free to charge as they like the rest of the year.
Two-hour flexibility window
Four-hour flexibility window
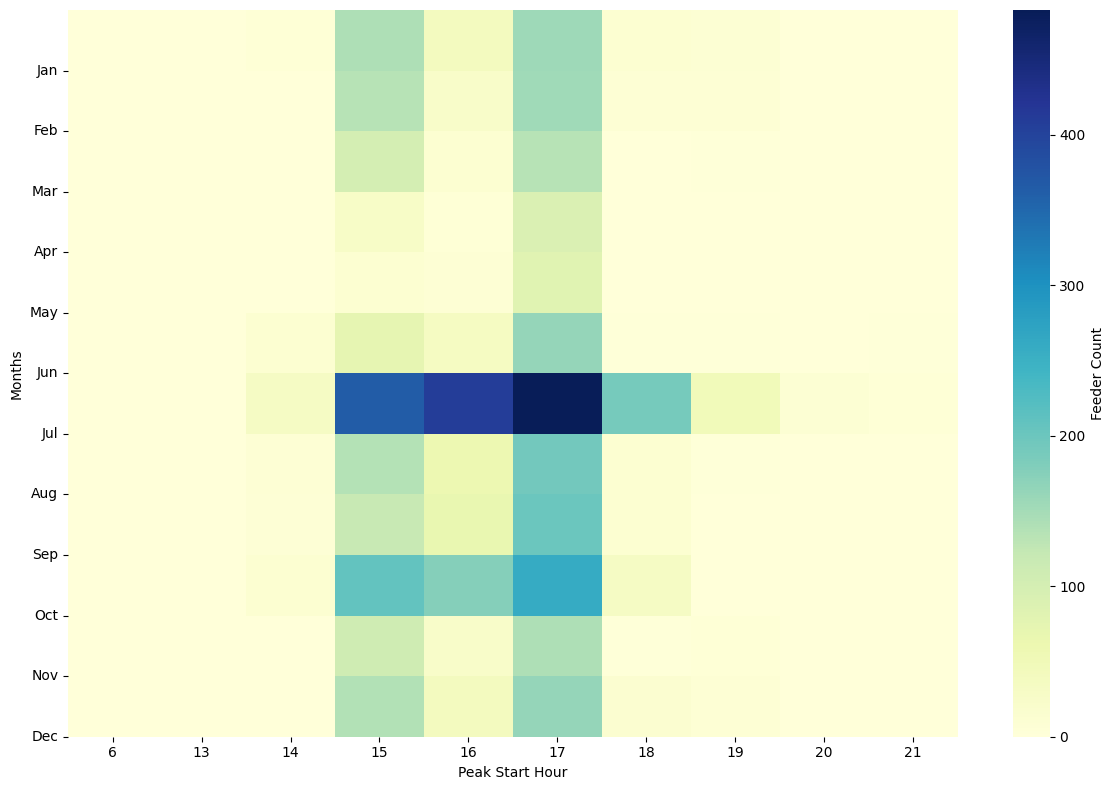
Note: Heatmap showing feeder counts of peak load start hour by month where flexibility is being triggered in the model optimization
Charging sites with the ability to shift their charging load over longer windows of time are better suited to capitalizing on a flexible service connection, However, fleets with alternate duty cycles to the average can still use flexible service connections through the addition of on-site battery storage. We plan to explore how this can expand the benefits of flexible service connections in a future analysis.
How does this compare to the real world today?
PG&E is currently the only utility in the country widely offering flexible service connections, through its Flex Connect program. It has demonstrated some early successes such as with PepsiCo being able to add an extra 20 electric trucks on regional haul routes previously fulfilled with diesel — a figure in line with our modeled estimates. The program uses sophisticated grid monitoring software to tell fleets the day before high-load days where they will need to shift their charging away from peak hours. More utilities, including SCE and National Grid, currently have pilot programs for flexible service connections and others still are considering it, including with programs that have seasonal instead of day-ahead capacity limits.
What’s next?
At scale, if more utilities invest in making the solution available in their territory, flexible service connections have the potential to absorb a large share of the load growth expected as electric truck adoption increases, while substantially increasing utilities’ rate base and allowing them to defer capital investments for upgrades. For fleets, it will allow them to energize their charging depots far faster than currently possible, enabling them to reap the fuel cost savings of running an electric truck, and save them money on utility infrastructure upgrade costs.
RMI research will continue in this space, with analysis quantifying the financial value of flexible service connections to both fleets and utilities. We will conduct additional modeling scenarios looking at how the potential benefits of flexible service connections vary with alternate fleet charging schedules, how they can reach greater scales with the addition of on-site battery storage, and how the potential scale of the solution varies in different geographies and utility service territories.
Appendix: Limitations to this analysis
In this analysis we have just shown what is technically feasible, to demonstrate the scale of potential benefits of flexible service connections to both fleets and utilities. However, improvements may be lower than our estimates due to even more conservative utility load forecasts than we have considered here. Utilities may also have a greater reserve-margin capacity below the feeder’s max rating on some feeders for safety reasons, although our modeling approach of looking at the number of additional trucks charged not total trucks would still work with a higher reserve margin. Additionally, we have not included the economic benefits of flexible service connections to fleets and utilities here, nor the cost of compliance or of obtaining managed charging capabilities where fleets don’t already possess that.
However, our other assumptions mean that the real potential may be higher. For example, we utilized a one-hour time resolution for loads, but with more advanced utility programs, more granular signals for flexible service connections could be used unlocking additional capacity through even shorter peak minute shifts. Additionally, in this initial analysis we limited the maximum amount of capacity able to be shifted in a single hour to 1 megawatt, so as not to impact site operations of a standard fleet too much. With the addition of on-site solar and battery storage this limit can be exceeded with no disruption to fleets. Additionally, in some cases adding these can be cost-effective through shaving load off peak time-of-use rates alone. We plan to explore this further in upcoming analysis
This analysis utilizes unmanaged load curves to determine the “business-as-usual” number of trucks able to be charged at each site, which the additional count is then measured against. These load curves assume trucks charge immediately on their return to depot, at 50 kW for urban and 150 kW for regional. Many fleets already manage their charging in a more sophisticated way than this to save money by shifting to lower off-peak rates, which may be hours after their return to depot, or by using lower power chargers over longer periods instead of fast charging. While this fact may lead to higher counts of additional trucks in our analysis compared to a “real world” load curve, it demonstrates an alternate way of thinking about those fleets currently responding to demand price signals as already being capable of complying with flexible service connection agreement.