
Where Gas Flaring Is Endangering Communities
Gas flaring emits harmful pollutants, and the effects are most acute the closer you are to a flare. Our new webtool — the Flaring EJ Risk Map — maps the communities most at risk from gas flaring.
Flaring — the practice of burning off unwanted gas — is widespread in the United States and worldwide. An estimated 140 billion cubic meters of gas valued at $16 billion went up in smoke globally in 2022 — wasted gas could have met the combined domestic demands of Japan and Italy. The United States has historically been ranked near the top (after Russia, Iraq, and Iran) as a country that flares significant gas from petroleum operations. In addition to burning money, wasting resources, and contributing to climate change, flaring poses an outsized risk to public health and welfare. Moreover, the environmental justice (EJ) aspects of flaring are skewed, with the negative impact of flaring falling disproportionately on marginalized communities. RMI has developed a new webtool – the Flaring EJ Risk Map – to identify the impact flares have on vulnerable communities, starting with US oil and gas production.
What is flaring?
Oil and gas are often extracted together. When the main product is oil, producers often flare the gas. The gas consists of a cocktail that is mostly methane along with volatile organics, sulfur compounds, and hazardous air toxins like benzene. While flares are designed to fully convert these gases into CO2 and water, in practice they do not operate at 100 percent efficiency. Studies find average flare efficiencies of 87 to 94 percent in US-based oil and gas operations. And too often flares are unlit — which results in pumping large volumes of dangerous gases into surrounding communities.
Impacts to the environment and public health
The CO2 and methane emitted by flares accelerate climate change. According to a recent study, methane emissions from flaring in the US are estimated at five times greater than currently reported in the US Environmental Protection Agency’s (EPA) Greenhouse Gas Inventory.
In addition to warming the planet, gas flares expose people to noxious gases. In the United States, an estimated 18 million people live within 2 kilometers (km) of an oil and gas well and half a million people live within 5 km of an active flare in the Permian and Eagle Ford basins (in Texas and New Mexico) and the Bakken basin (in North Dakota and Montana).
Flares and their associated emissions are known to cause preterm births, pediatric asthma, exacerbate pulmonary problems, and form smog, which is linked to cardiovascular, nervous system, and reproductive health issues. Some of the gas burned in flares like benzene are known carcinogens linked to birth defects. People of color are disproportionately impacted, elevating EJ risks.
Mapping environmental justice risks from flared gas
Oil and gas production has wide-ranging climate impacts that are analyzed using RMI’s Oil Climate Index plus Gas (OCI+) web tool. But local impacts to nearby communities vary too.
A new environmental justice (EJ) risk feature has been added to the OCI+ that considers underlying demographics in the vicinity of flares. The Flaring EJ Risk Map highlights environmental justice risks to residents in nearby communities from gas flared in upstream oil production activities. There are two layers on the Flaring EJ Risk Map reflecting two different perspectives.
The first map layer explores those communities that are most affected by flares. A choropleth map — a color-coded map used to represent statistical data — ranks the relative impacts on one community compared to another within the country and within the state. Exhibit 1 illustrates the choropleth map of the Eagle Ford Shale formation in Southeastern Texas. This region spans from Laredo near the Mexico border northeast between Houston and Austin, encompassing 23 counties, where nearly 700,000 people reside outside the urban area and millions more inhabit the surrounding cities. Over one-half of these non-urban residents — 400,000 people (a majority non-white) — live within 5 km of an oil or gas well.
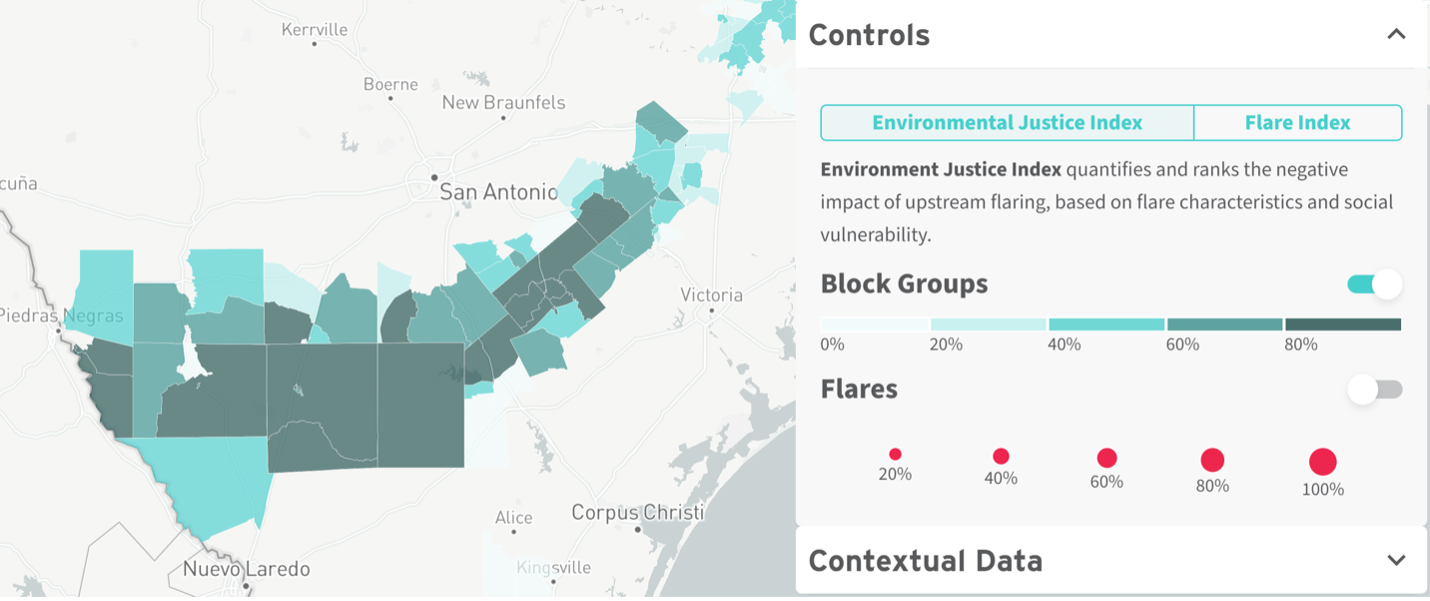
Note: This uses a similar methodology to EPA’s EJScreen that combines environmental and socioeconomic information to index and map the relative harm to EJ communities.
The second perspective considers the flares that pose the worst environmental justice risks. A layer of flare points rank the negative impact of flares relative to others. Exhibit 2 illustrates flaring points in Eagle Ford Shale basin.
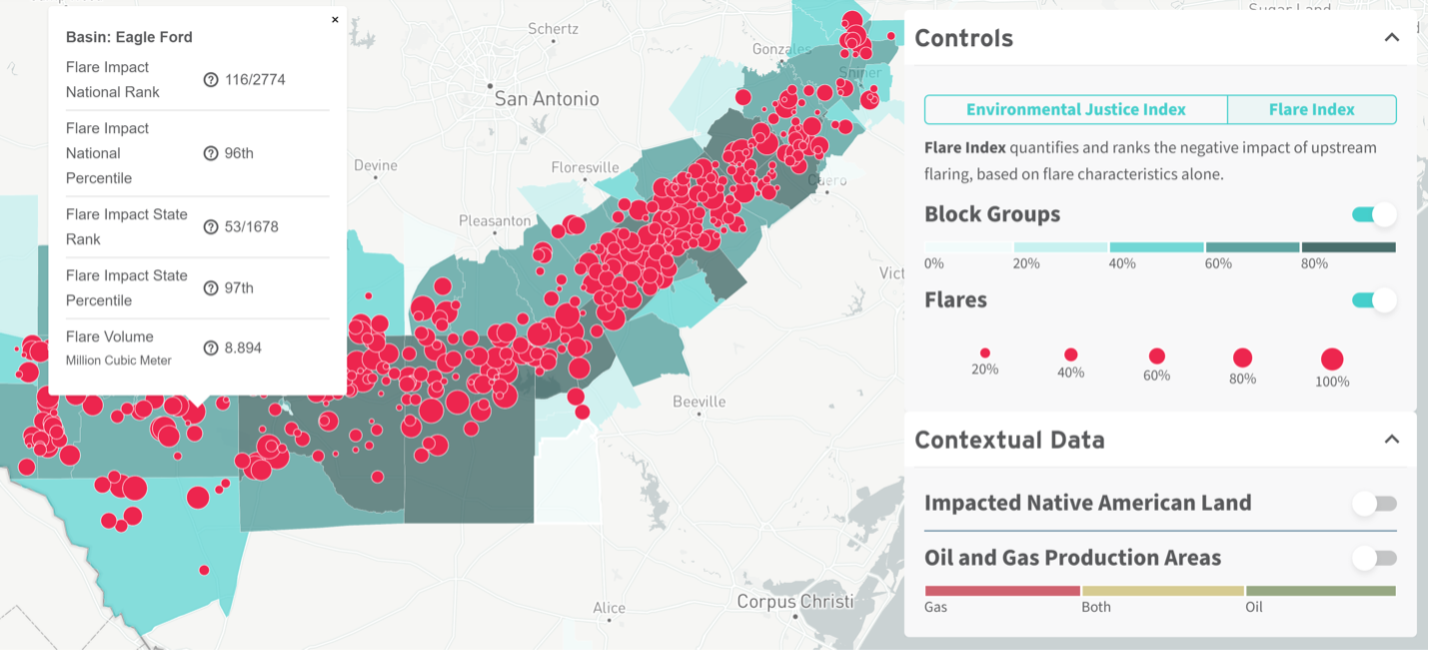
Note: Flared gas locations and volumes are obtained from NOAA VIIRS satellite data that is analyzed by the Earth Observation Group at the Colorado School of Mines’ Payne Institute. The figures above use this 2022 US flaring data filtered for upstream oil and gas production activities.
Next steps on mapping flaring’s EJ risks
With the detailed information provided by the first phase of the Flaring EJ Risk Map project, decision makers can better protect public health and the environment, especially for vulnerable populations. Communities can call for policies that address past environmental harm and pave the way to a healthier, safer, and climate-resilient future. Investors can use this information to direct environmental, sustainable, governance funds away from operations with the greatest EJ impacts.
In future iterations, the Flaring EJ Risk Map could entail adding downstream oil and gas flares from US refineries and petrochemical facilities. We are also considering expanding this effort internationally to compare EJ risks beyond the United States. Flared gas poses outsized concerns for people and the planet. As we eliminate routine flaring, the first place to start is in the most vulnerable communities.